Research Writing SY2006

Wednesday, March 22, 2006

Discussion

Discussion
General intent
The objective here is to provide an interpretation of your results and support for all of your conclusions, using evidence from your experiment and generally accepted knowledge, if appropriate. The significance of findings should be clearly described.

Writing a discussion
Interpret your data in the discussion in appropriate depth. This means that when you explain a phenomenon you must describe mechanisms that may account for the observation. If your results differ from your expectations, explain why that may have happened. If your results agree, then describe the theory that the evidence supported. It is never appropriate to simply state that the data agreed with expectations, and let it drop at that.

Decide if each hypothesis is supported, rejected, or if you cannot make a decision with confidence. Do not simply dismiss a study or part of a study as "inconclusive."
Research papers are not accepted if the work is incomplete. Draw what conclusions you can based upon the results that you have, and treat the study as a finished work
You may suggest future directions, such as how the experiment might be modified to accomplish another objective.
Explain all of your observations as much as possible, focusing on mechanisms.
Decide if the experimental design adequately addressed the hypothesis, and whether or not it was properly controlled.
Try to offer alternative explanations if reasonable alternatives exist.

One experiment/research project will not answer an overall question, so keeping the big picture in mind, where do you go next? The best studies open up new avenues of research. What questions remain?

Recommendations for specific papers will provide additional suggestions.

Style:

When you refer to information, distinguish data generated by your own studies from published information or from information obtained from other students (verb tense is an important tool for accomplishing that purpose).
Refer to work done by specific individuals (including yourself) in past tense.
Refer to generally accepted facts and principles in present tense.

The biggest mistake that students make in discussions is to present a superficial interpretation that more or less re-states the results. It is necessary to suggest why results came out as they did.
-------------------
The text above was retrieved from this site.

Results

Results

The page length of this section is set by the amount and types of data to be reported. Continue to be concise, using figures and tables, if appropriate, to present results most effectively. See recommendations for content, below.

General intentThe purpose of a results section is to present and illustrate your findings. Make this section a completely objective report of the results, and save all interpretation for the discussion.

Writing a results section
IMPORTANT: You must clearly distinguish material that would normally be included in a research article from any raw data or other appendix material that would not be published. In fact, such material should not be submitted at all unless requested by the instructor.

Content
Summarize your findings in text and illustrate them, if appropriate, with figures and tables.
In text, describe each of your results, pointing the reader to observations that are most relevant.
Provide a context, such as by describing the question that was addressed by making a particular observation.
Describe results of control experiments and include observations that are not presented in a formal figure or table, if appropriate.
Analyze your data, then prepare the analyzed (converted) data in the form of a figure (graph), table, or in text form.
What to avoid

Do not discuss or interpret your results, report background information, or attempt to explain anything.
Never include raw data or intermediate calculations in a research paper.
Do not present the same data more than once.
Text should complement any figures or tables, not repeat the same information.
Please do not confuse figures with tables - there is a difference.

Style

As always, use past tense when you refer to your results, and put everything in a logical order.
In text, refer to each figure as "figure 1," "figure 2," etc. ; number your tables as well (see the reference text for details)
Place figures and tables, properly numbered, in order at the end of the report (clearly distinguish them from any other material such as raw data, standard curves, etc.)
If you prefer, you may place your figures and tables appropriately within the text of your results section.

Figures and tables

Either place figures and tables within the text of the result, or include them in the back of the report (following Literature Cited) - do one or the other
If you place figures and tables at the end of the report, make sure they are clearly distinguished from any attached appendix materials, such as raw data
Regardless of placement, each figure must be numbered consecutively and complete with caption (caption goes under the figure)
Regardless of placement, each table must be titled, numbered consecutively and complete with heading (title with description goes above the table)
Each figure and table must be sufficiently complete that it could stand on its own, separate from text

-----------------
The above text was retrieved from this site.

Wednesday, March 08, 2006

Using Excel for survey analysis

Using Excel for survey analysis  Posted by Picasa


http://www.audiencedialogue.org/excel6.html

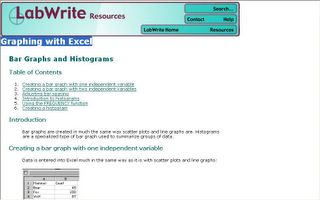
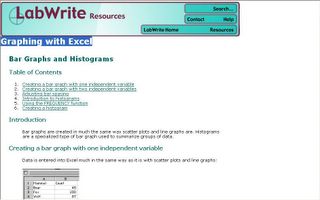
Graphing with Excel

Graphing with Excel Posted by Picasa


http://www.ncsu.edu/labwrite/res/gt/gt-bar-home.html

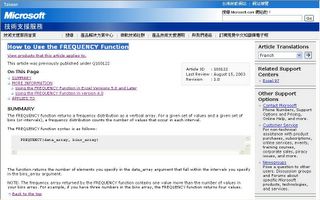
How to Use the FREQUENCY Function

How to Use the FREQUENCY Function Posted by Picasa


http://support.microsoft.com/?kbid=100122

Tuesday, March 07, 2006

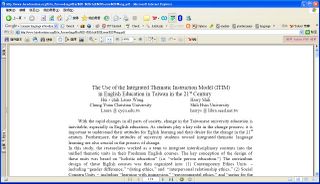
The Use of the Integrated Thematic Instruction Model

The Use of the Integrated Thematic Instruction Model (ITIM)
in English Education in Taiwan in the 21st Century
 Posted by Picasa


Click here to download/print the article.

Evaluating Distance Learning in Graduate Programs

Evaluating Distance Learning in Graduate Programs: Ensuring Rigorous, Rewarding Professional Education
Copyright 2001 Gorge Hayhoe Associates  Posted by Picasa


http://www.puw.pl/downloads/docs/evaluating.pdf

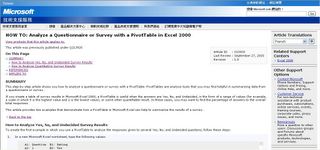
Analyze a Questionnaire or Survey with a PivotTable in Excel

HOW TO: Analyze a Questionnaire or Survey with a PivotTable in Excel 2000 Posted by Picasa


http://support.microsoft.com/?kbid=213920

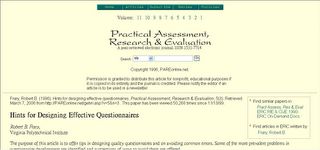
Hints for Designing Effective Questionnaires

Hints for Designing Effective Questionnaires
Robert B. Frary,
Virginia Polytechnical Institute
 Posted by Picasa


http://pareonline.net/getvn.asp?v=5&n=3

Another example of paper

What is Learner Autonomy and How Can It Be Fostered?
Dimitrios Thanasoulas
akasa74 [at] hotmail.com Posted by Picasa


Here's another example of paper without using questionnaires or surveys, click the link below
http://iteslj.org/Articles/Thanasoulas-Autonomy.html

A research paper example

Paradigm Shift: Understanding and Implementing Change in Second Language Education

George M Jacobs
JF New Paradigm Education
Singapore

Thomas S C Farrell
National Institute of Education
Singapore

[New address in bio-data -- Ed]
 Posted by Picasa


http://www-writing.berkeley.edu/TESL-EJ/ej17/a1.html

This type of writing is a good example for Isaac and others who are not doing surveys or interviews.