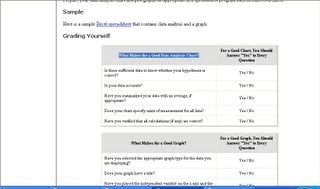
What Makes for a Good Data Analysis Chart? What Makes for a Good Graph? Calculations and Summarizing Data


Note:
The way you analyze your data depends on what you want to include that will help you support your argument. If the results of your findings are contrary to what you were expecting, then you need to report them, too.
Analyzing Your Data
After you have collected the completed surveys, it is time to analyze the data. Data can be analyzed by entering it into an Excel sheet and computing your numbers or by using a statistical software program. Getting volunteers on board is a great way to save your organization time and resources during this stage.
Note: If someone has not responded to a question it is often assumed they would answer as others have. However this is not always the case and assumptions cannot be made from a non-respondent. Only consider information that has been actually answered.


